AI observability is the practice of collecting and connecting signals from your data, your models, and the infrastructure they run on, so you can see what your AI system is doing and why. It goes beyond telling you something broke. It helps you find the cause and fix it.
A model that ships a better design, a faster diagnosis, or a sharper forecast depends on a long chain of parts working together. When one part drifts, slows down, or fails quietly, the output suffers. Observability makes that chain visible. If you're new to the infrastructure side, start with our guide to what an AI cloud is.
Monitoring vs. Observability: What's the Difference?
People often use the two terms as if they mean the same thing. They don't.
Monitoring watches signals you already know matter, such as latency, error rate, or GPU utilization. It alerts you when a number crosses a threshold. It tells you that something is wrong.
Observability lets you ask new questions of your system after something breaks. It tells you why. You can trace a slow response back to a throttled network link, or a drop in accuracy back to a change in your data pipeline.
You need both. Monitoring is your early warning. Observability is your investigation.
Why AI Systems Fail Without Visibility
AI fails in ways standard dashboards don't show. A model can return fluent, confident, wrong answers while every status light stays green. A distributed training job can stall because one GPU out of thousands faulted. The figures below show how common these problems are.
- 466 job interruptions in 54 days. That is what Meta reported during its Llama 3 405B training run on 16,384 GPUs. 419 were unexpected, and about 78% of those were attributed to confirmed or suspected hardware issues. At cluster scale, failures are routine, so you need to detect and isolate them fast. Source: Meta, The Llama 3 Herd of Models and DCD coverage.
- 38–43% model FLOPs utilization (MFU). That is what Meta reported for the same run. Even a highly tuned, well-resourced team did not use most of its GPUs' theoretical peak. Visibility shows where the gap is. Source: Meta, The Llama 3 Herd of Models.
- At least 30% of GenAI projects abandoned after proof of concept. Gartner predicted this in July 2024 for the end of 2025, citing poor data quality, inadequate risk controls, escalating costs, or unclear business value. Data quality and cost control are observability problems, not just planning problems. Source: Gartner, July 2024.
- More than 80% of AI projects fail, by some estimates. That is twice the rate for IT projects without AI. RAND's interviews with 65 experienced engineers point to missing data and insufficient infrastructure among the root causes. Source: RAND, 2024.
The Meta run also shows what good visibility buys. The team kept effective training time above 90%, and only three interruptions needed significant manual intervention. Automation handled the rest. You can't automate recovery from failures you can't see.
The Three Layers of AI Observability
AI systems break in three places. Full-stack visibility covers all of them.
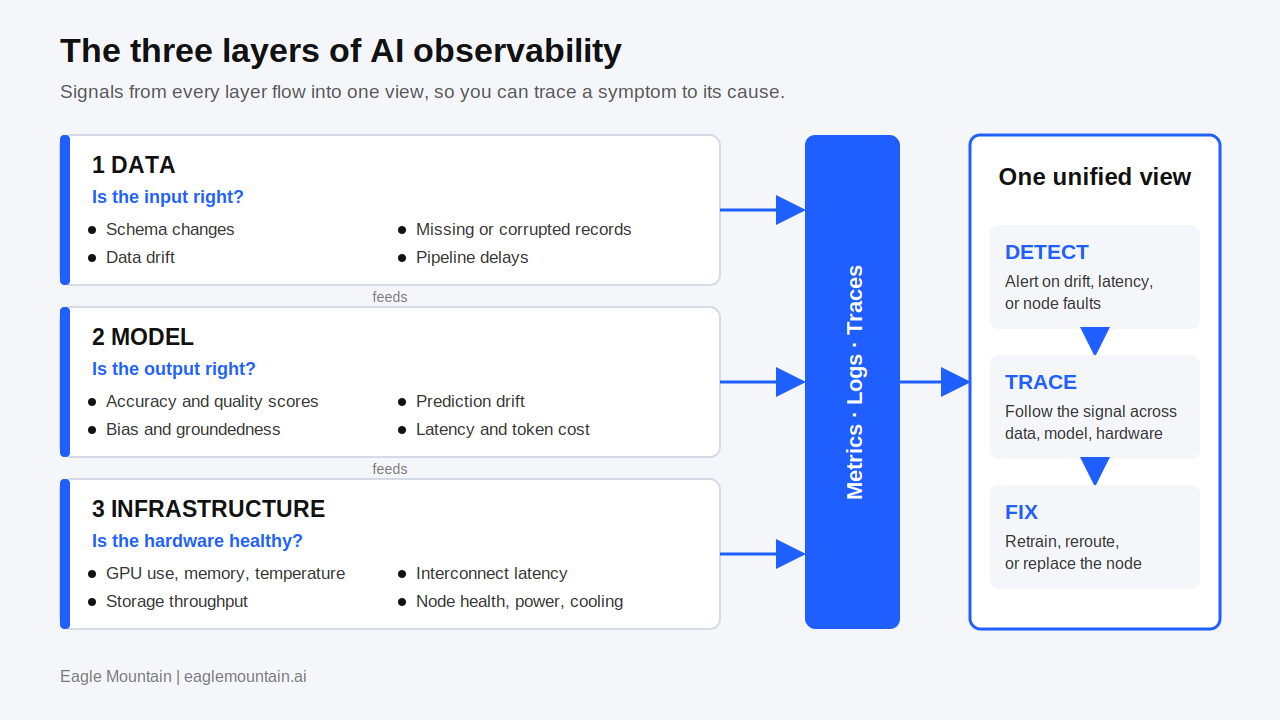
1. Data observability
Models are only as good as their inputs. Data observability checks that your data is complete, fresh, and consistent.
Signals to track: schema changes, missing or corrupted records, data drift, and pipeline delays.
2. Model observability
Model observability shows how a model behaves in training and in production.
Signals to track: accuracy and quality scores, prediction drift, bias and fairness indicators, and confidence calibration. For generative models, also track hallucination rate, groundedness, token use, and response time.
3. Infrastructure observability
This layer covers the compute, storage, and networking underneath your models. For AI, it is where cost and reliability are won or lost. It starts with the GPU compute, storage, and networking you run on. For background on how this infrastructure is built, see data center questions answered.
Signals to track: GPU utilization, memory, and temperature; interconnect latency; storage throughput; node health and job failures; and power and cooling performance.
A gap in any layer leaves you guessing. If accuracy drops and you can only see the model, you won't know whether the cause is the data or a failing node.
AI Observability vs. LLM Observability
You'll see both terms. They overlap, but the scope differs.
AI observability
- Scope: all AI and machine learning systems
- Covers: data, models, and infrastructure
- Key question: Is the whole AI system healthy and efficient?
LLM observability
- Scope: applications built on large language models
- Covers: prompts, retrieval, responses, and post-processing
- Key question: Why did the model give this answer?
LLM observability explains how a language model behaved. AI observability also shows what the data and hardware were doing at the time. For AI agents, which plan, call tools, and take many steps per request, you also need a trace of each step, so a wrong final answer has a visible cause.
Common Failure Modes AI Observability Catches
- Data drift: inputs change and accuracy falls, with no error raised.
- Silent model degradation: outputs get worse in small steps no one notices.
- Idle GPUs: expensive hardware waits on slow data or a slow network.
- Node failures: one bad node stops a distributed training job.
- Latency spikes: inference slows because of a network or capacity problem, not the model. Read why low-latency AI requires more than a bigger GPU cluster.
- Runaway cost: token use or compute climbs with no one tracking it.
- Alert fatigue: too many low-value alerts bury the ones that matter.
Best Practices for AI Observability
- Unify your telemetry. Put data, model, and infrastructure signals in one view, so a drop in accuracy leads you to its cause without switching tools.
- Build on open standards. Use tools and formats your team already knows, such as Prometheus, Grafana, and OpenTelemetry.
- Cover the full lifecycle. Training, fine-tuning, and inference each fail in different ways. Instrument all three.
- Trace requests end to end. For LLM apps and agents, capture each step, not just the final answer.
- Alert on what you can act on. Tune thresholds, group related signals, and drop the noise.
- Plan for scale. Use checkpoints, health probes, and resilient pipelines, so observability still works when a job spans thousands of GPUs.
How to Choose an AI Observability Platform
- Does it cover all three layers? Data, model, and infrastructure.
- Can it see down to the hardware? GPU, network, storage, power, and cooling.
- Does it support tracing for LLMs and agents?
- Does it work with your existing stack? Open standards and common integrations matter.
- Does it scale with your cluster? Test it at your expected size.
Where Infrastructure Observability Starts
Many AI problems begin at the infrastructure layer, and many observability tools don't look there. That's where we focus.
At Eagle Mountain, we run bare-metal AI infrastructure and build observability into it from the start:
- TriCore gives you continuous telemetry and cluster health visibility, so you see failing nodes and idle capacity before they stall a job.
- LumaCore is our platform layer for observability, security, and ML tooling, so your teams work from one view.
- Swift IQ adds managed services that remove operational bottlenecks.
Our edge AI-factories also put compute close to your data and customers. That keeps inference latency low and gives you a clear view of performance where your users are, not just in a distant data center.
Explore our platform | Talk to our team
AI systems fail in ways standard dashboards don't show. AI observability closes that gap. It connects your data, your models, and your hardware, so you can find problems early, fix them fast, and keep your AI delivering results you can trust.
Put your AI workload to the test. Contact Eagle Mountain to see how we deliver visibility from the rack up, or view pricing.
Frequently Asked Questions
What is AI observability?
AI observability is the practice of collecting and correlating signals from data, models, and infrastructure so you can understand how an AI system behaves and diagnose problems in production.
What is the difference between monitoring and observability?
Monitoring watches known metrics and alerts you when something is wrong. Observability lets you investigate why it happened, including problems you didn't anticipate.
What is the difference between AI observability and LLM observability?
LLM observability focuses on applications built on language models: prompts, retrieval, responses, and cost. AI observability is broader. It also covers other models, data pipelines, and the infrastructure underneath.
What metrics should I track?
Track data quality and drift, model accuracy and response quality, latency, token use, GPU utilization, memory, network throughput, and node health. Start with the signals tied to your biggest risks.
Why do AI workloads fail?
Common causes include bad or drifting data, hardware faults in tightly coupled training jobs, resource shortages, and corrupted checkpoints. In Meta's Llama 3 training run, about 78% of unexpected interruptions were attributed to confirmed or suspected hardware issues.
Do I need observability if I use a hosted model API?
Yes. You may not control the model, but you still need to trace your prompts, retrieval, latency, cost, and output quality.
How do I get started?
Pick one workload. Instrument its data, model, and infrastructure signals, put them in one view, and set a small number of actionable alerts. Expand from there.